Background
The daily returns of our trading strategy can be volatile, especially during periods of extreme overall market volatility across asset classes. During these times, multiple signals are usually triggered within the same asset class which has the effect of amplifying the daily gains/losses of the trading system. The greatest daily gain/loss amounts have been more than 9% historically. A day when 9% of account equity could be lost is difficult to stomach for any investor, institutional investors especially.
Every position that the strategy trades is equipped with its own stop loss order, however we would like to investigate the idea of a portfolio wide stop loss. With a portfolio wide stop loss, we would like to exit all positions if the account equity drops by x% in a single day, This could help mitigate the risk of seeing another day with losses greater than 9%.
Test Process
For this test we used intraday data from IQFeed and the dates of our actual historical trades. A custom component was written for Multi Charts to read the strategy’s trade history and map the execution dates to the intraday data. A new strategy for MultiCharts was then written to close all positions once the account equity dropped below a specified amount on any given day.
All 19 futures markets that the strategy trades were loaded into MultiCharts and the historical data was separated into an in-sample and out-of-sample group. The in-sample data range was 7/2007 – 7/2010, and the out-of-sample data range was 8/2010-4/2014.
A baseline test scenario was run on the in sample data with no portfolio stop loss with additional tests run with stop loss values ranging from 2%-7%. The best performing stop loss would be selected, and tests would be run on the out-of-sample data for each stop loss level to see how they performed moving forward.
The test cases would assume a starting account equity of $1MM, and slippage would vary based on commodity, ranging anywhere from $0 – $100 per contract depending on historical slippage that has been observed in each of the markets that are traded.
The goal of the stop loss is to minimize the negative impact to the trading strategy performance that the stop loss may have, while minimizing the risk of a large loss in account equity during times of extreme volatility.
In Sample Results
As previously mentioned, a base scenario was run with no portfolio stop loss, and then tests were run with stop loss values ranging from 2%-7% in 1% increments. The table below shows the results for the in-sample tests with the test metrics explained below the table.
|
Baseline |
7% |
6% |
5% |
4% |
3% |
2% |
|
|
Net Gain |
$822,725 |
$822,725 |
$822,725 |
$840,035 |
$611,559 |
$436,065 |
$522,772 |
|
Total Return |
82.27% |
82.27% |
82.27% |
84.00% |
61.16% |
43.61% |
52.28% |
|
Profit Factor |
1.44 |
1.44 |
1.44 |
1.44 |
1.34 |
1.24 |
1.29 |
|
Max Draw % |
-16.40% |
-16.40% |
-16.40% |
-14.86% |
-15.54% |
-12.50% |
-13.83% |
|
Return/Max Draw |
3.93 |
3.93 |
3.93 |
4.01 |
3.20 |
2.60 |
3.10 |
|
GTP Ratio |
2.02 |
2.02 |
2.02 |
2.02 |
1.73 |
1.03 |
1.31 |
|
Worst Day |
-4.69% |
-4.69% |
-4.69% |
-5.17% |
-4.71% |
-3.62% |
-3.13% |
|
Best Day |
7.87% |
7.87% |
7.87% |
7.81% |
7.61% |
7.88% |
6.44% |
|
0 |
0 |
0 |
2 |
6 |
14 |
31 |
Table 1: In-Sample Test Results
Net Gain: The profit earned by the trading strategy during the in-sample period.
Total Return:: The strategy’s % return during the test period.
Profit Factor: Gross Profit divided by Gross Loss
Max Draw %: The maximum drawdown experienced by the strategy.
Return/Max Draw: The total return divided by the maximum drawdown. This is a good measure of risk adjusted return.
GTP Ratio: Gain-To-Pain ratio. This performance metric was developed by Jack Schwager and is also a good measurement of risk adjusted return. The GTP ratio is calculated by dividing the sum of the monthly returns by the sum of the returns for months that had a negative return. This the effect of penalizing strategy volatility to the downside, but not upside volatility.
Worst Day: Strategy return on the worst day over the test period.
Best Day: Strategy return on the best day during the test period.
Stop Loss Days: The number of times the portfolio stop loss was be triggered.
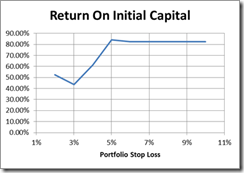
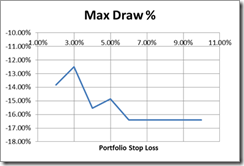
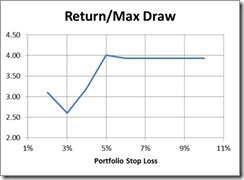
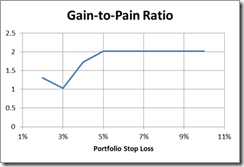
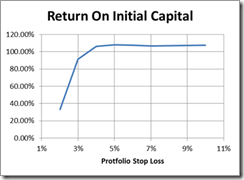
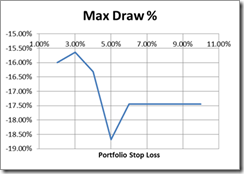
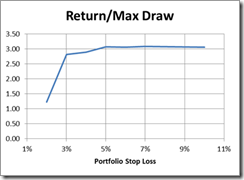
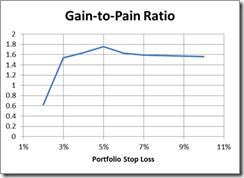
Some metrics were charted across all stop loss values to help decide where an appropriate stop loss value may be.
Based on the results, the strategy’s performance begins to suffer with anything greater than a 5% stop loss amount. Results for stop loss values of 5% or greater are static as there were not any days with more than a 5% loss. The value for worst day is greater than the stop amount in some cases, as in the
-4.71% maximum loss with a 4% stop due to positions due to slippage. A 5% stop loss will be selected as it will help protect the account equity from the -9% day with the least impact to the trading results based on the in sample testing.
Out of Sample Tests
Out of Sample tests were run from 8/2010 – 4/2014 to see how the various stop levels performed moving forward. The results of those tests are below.
|
Baseline |
7% |
6% |
5% |
4% |
3% |
2% |
|
|
Net Gain |
$1,078,592 |
$1,065,662 |
$1,078,578 |
$1,082,004 |
$1,062,804 |
$916,433 |
$333,811 |
|
Total Return |
107.86% |
106.56% |
107.86% |
108.20% |
106.28% |
91.64% |
33.38% |
|
Profit Factor |
1.36 |
1.36 |
1.36 |
1.37 |
1.35 |
1.32 |
1.14 |
|
Max |
-17.45% |
-17.45% |
-17.45% |
-18.68% |
-16.32% |
-15.64% |
-16.00% |
|
Return/Max Draw |
3.06 |
3.08 |
3.06 |
3.07 |
2.89 |
2.82 |
1.23 |
|
GTP Ratio |
1.56 |
1.59 |
1.63 |
1.76 |
1.64 |
1.54 |
0.62 |
|
Worst Day |
-10.42% |
-7.32% |
-6.30% |
-5.78% |
-4.58% |
-3.60% |
-3.45% |
|
Best Day |
8.34% |
8.34% |
8.34% |
8.34% |
8.34% |
8.34% |
8.40% |
|
Stop |
0 |
1 |
3 |
3 |
4 |
8 |
43 |
Table 2: Out of Sample Results
Based on these result, the 5% stop loss continues to perform well in all areas, except for strategy drawdown where it is the worst of all stop loss values. This however is made up for by the fact that the total system return is the greatest out of all the stop loss values, which means that the ratio of the total return to max drawdown is comparable with values greater than 5%.
Conclusion
Moving forward, a daily portfolio stop loss will be implemented at the 5% level. If account equity drops by 5% since the previous day, then all positions will be exited. Further studies could be done to see if improvements can be made to this strategy, such as only closing unprofitable positions, or closing some, but not all positions in specific sectors, depending on how the overall sector is performing.
twitter: @LimitUpTrading
twitter: @RobTerp
